Dragon Con: A Retrospective Journey
Problem Description
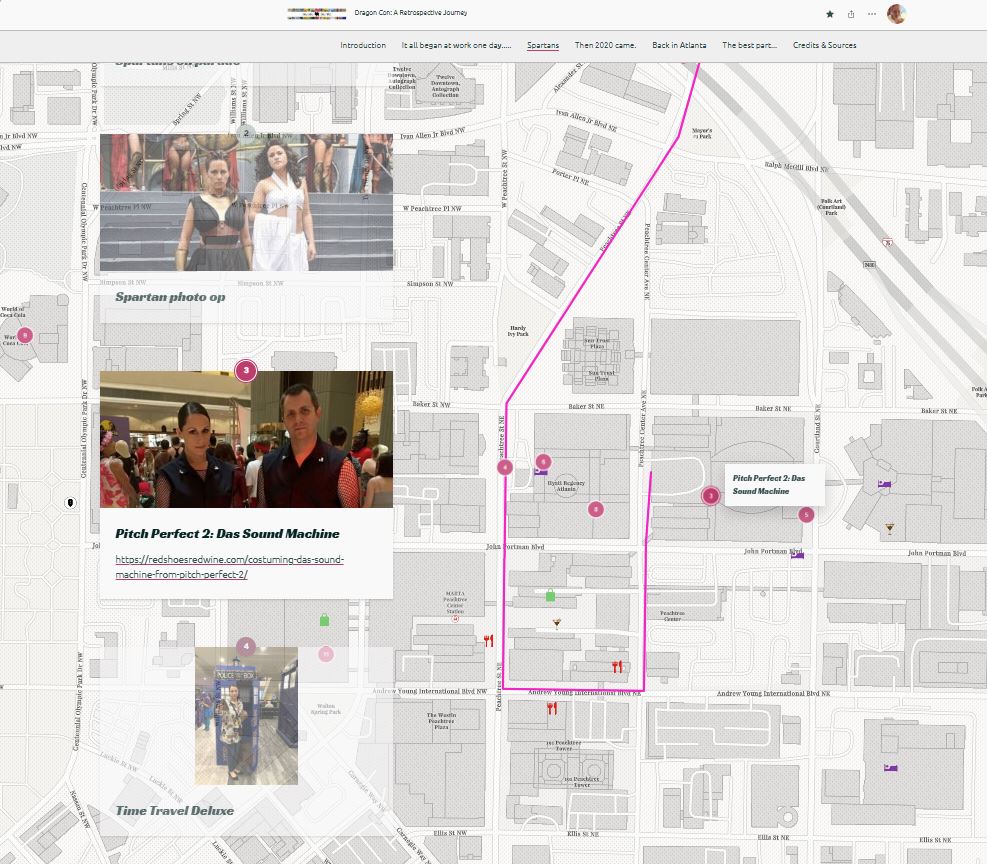
This Story Map tells the story of a friend’s decade-long journey attending Dragon Con, Atlanta’s iconic pop-culture convention. What started as a creative challenge became an exploration of how place, time, and travel shape personal narratives. The story traces the journey from a first-time attendee to a recognized cosplay maker, weaving together geography, community, and creativity.

Analysis Procedures
The project involved identifying the spatial and temporal threads within a personal narrative and translating them into an engaging web experience using ArcGIS Story Maps. First the places and timelines had to be established and mapped, then the images compiled and included.
Key locations — from Houston to Atlanta’s host hotels to a pandemic-era Hill Country retreat — anchor the story geographically. Media, imagery, and first-person accounts were curated and integrated to bring the narrative to life for a general audience.
Results
This project turned out even better than I expected. The end result was an informative, interesting exploration of journeys of friendship over time. Building this spatial story took us on another kind of discovery journey as we considered how to tell the story with a different kind of format.
Reflection
Imagining how to showcase someone’s journey over the course of several years on an experience map was an engaging and challenging project. Even though I was familiar with the content and the people in the story, compiling the information in this way brought new dimensions to what I already knew, and illustrated that when you bring the element of place to the conversation it can be transformative.
Red Cross Volunteer Availability Survey
Problem Description
At the time I designed this survey, the common practice for my local chapter of the Red Cross to call up volunteers was to reach out via SMS text and email, then compile those results to staff an operation. This seemed like a prime opportunity to create a smoother, more effective solution.
Analysis Procedures
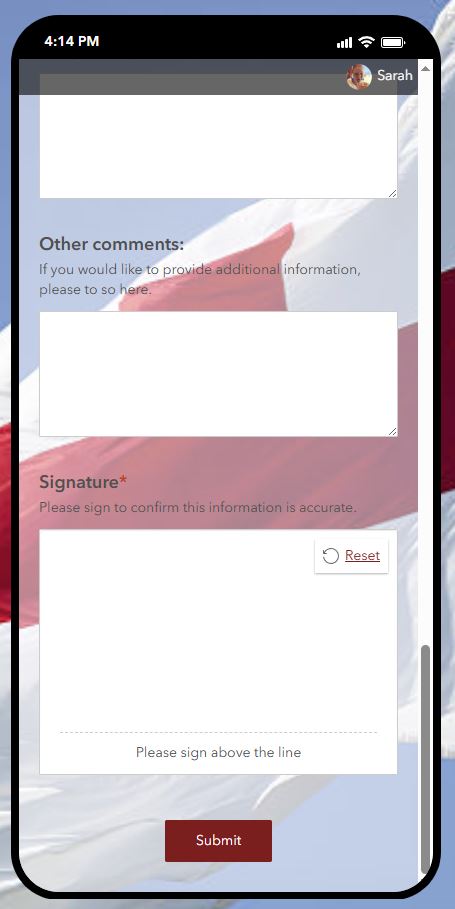
I designed a survey to assess readiness to respond for Red Cross volunteers. In the survey, content is divided into three sections: general volunteer information, response-specific information, and basic (less important) volunteer details.
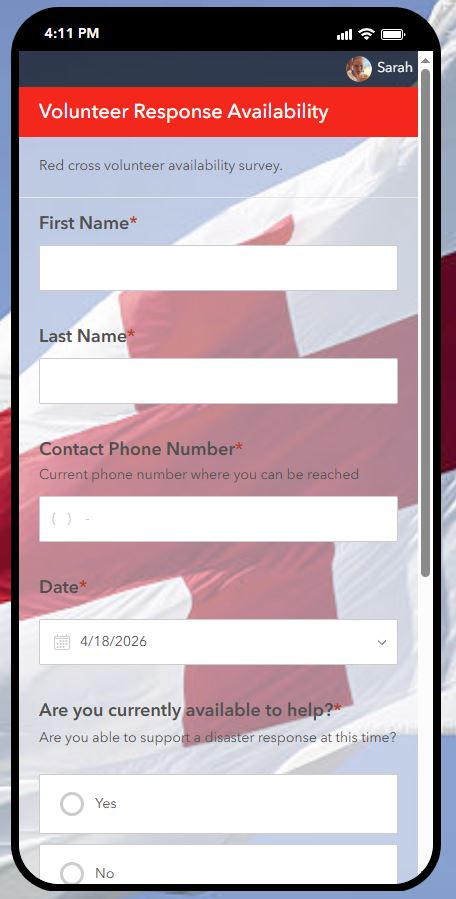
Questions are ordered by priority, with response-critical options at the top of the survey. Responders can fill out the second portion regarding their availability multiple times, since this is something that could change daily, while the basic information is less likely to.
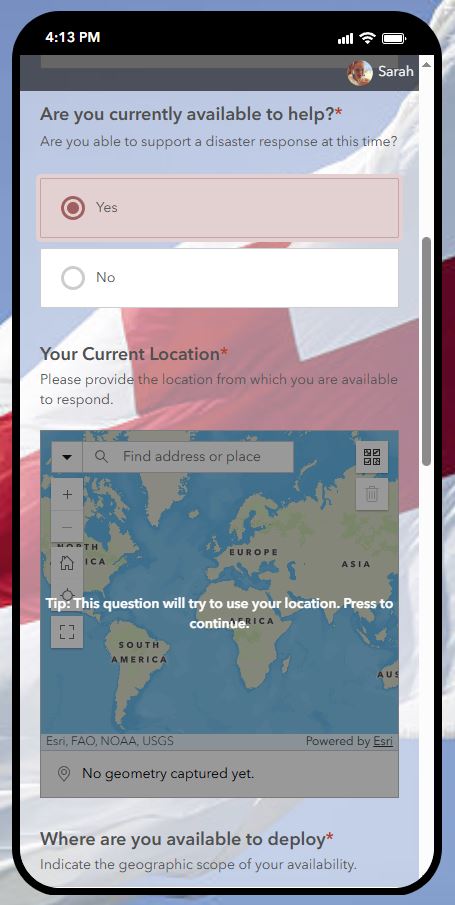
In the second section, the respondent identifies if they are replying for a current operation or updating their general availability. The next questions are dependent on the option selected here, using branching logic to open the next question.
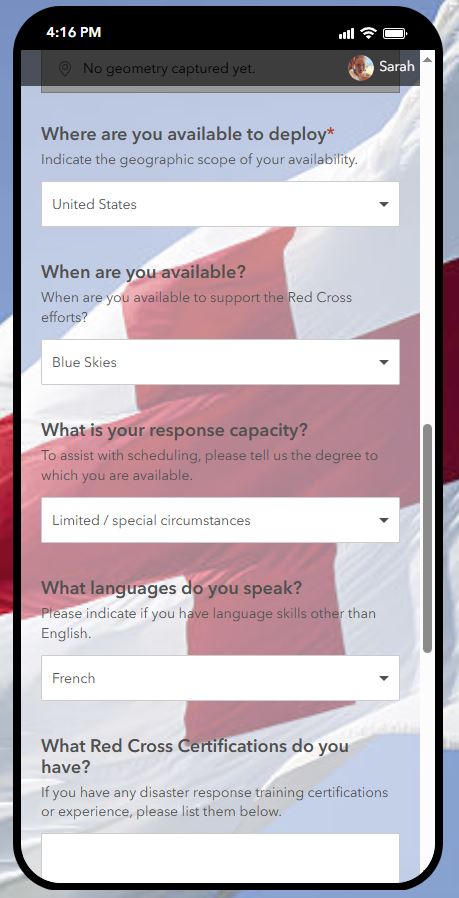
In the third section of the survey asks general questions, some of which are required and some of which are not, based on Red Cross requirements for volunteers.
Results
This survey offers more robust data collection capabilities because it allows respondents to update their answers and it includes an option to respond to a current disaster in addition to generally updating records.
Reflection
This was an engaging way to use my skills to assist and improve a local volunteer organization I am passionate about. I shared my results with contacts at the chapter, and by the very next operation they were utilizing this concept to reach out to volunteers.
I hope to continue using my GIS skills in my volunteer efforts at the Red Cross.
