Developing Automated Tool for Modeling Metocean Conditions using HYCOM Data
Problem Description
The complex process of loading and formatting HYCOM (Hybrid Coordinate Ocean Model) data is a significant barrier to being able to use the data in analysis. This data is used to model currents and variations in temperature and salinity in the vertical ocean column. The fundamental challenge is accessibility. Automating the download and formatting process would make this data more readily available to researchers.
Analysis Procedures
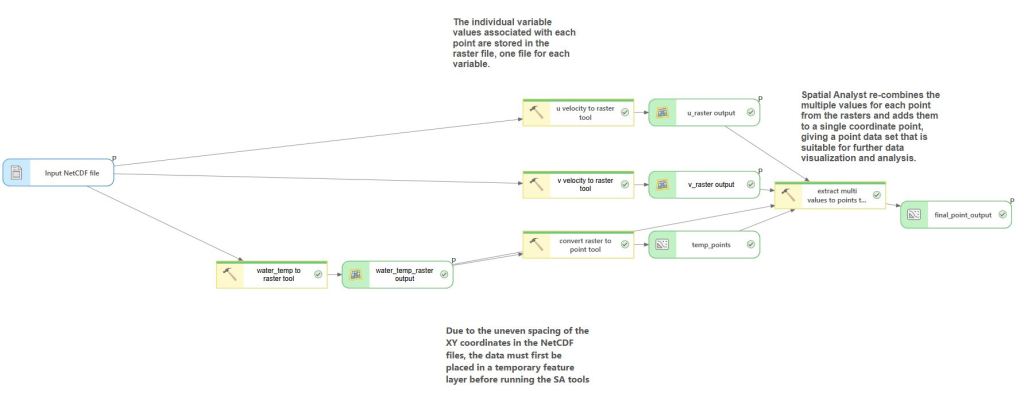
To do this, I built a custom Python script tool in ArcGIS Pro, so users can directly access the HYCOM model data retrieval and processing. The tool presents a simple GUI where the user inputs a bounding box defined by four coordinates, scoping the download to their area of interest. From there, the script handles the remaining steps automatically: pulling the data from HYCOM, formatting the output files, and converting them from NetCDF format into something ArcGIS Pro can work with meaningfully. While ArcPro can read NetCDF files natively as rasters, additional geoprocessing steps are required to transform that data into a proper point feature class, which is what the tool does for the user.
Once processing is complete, a summary report of the downloaded data is created using a combination of HTML and the ArcPy mapping module, giving users their results without any extra manual steps.
Results
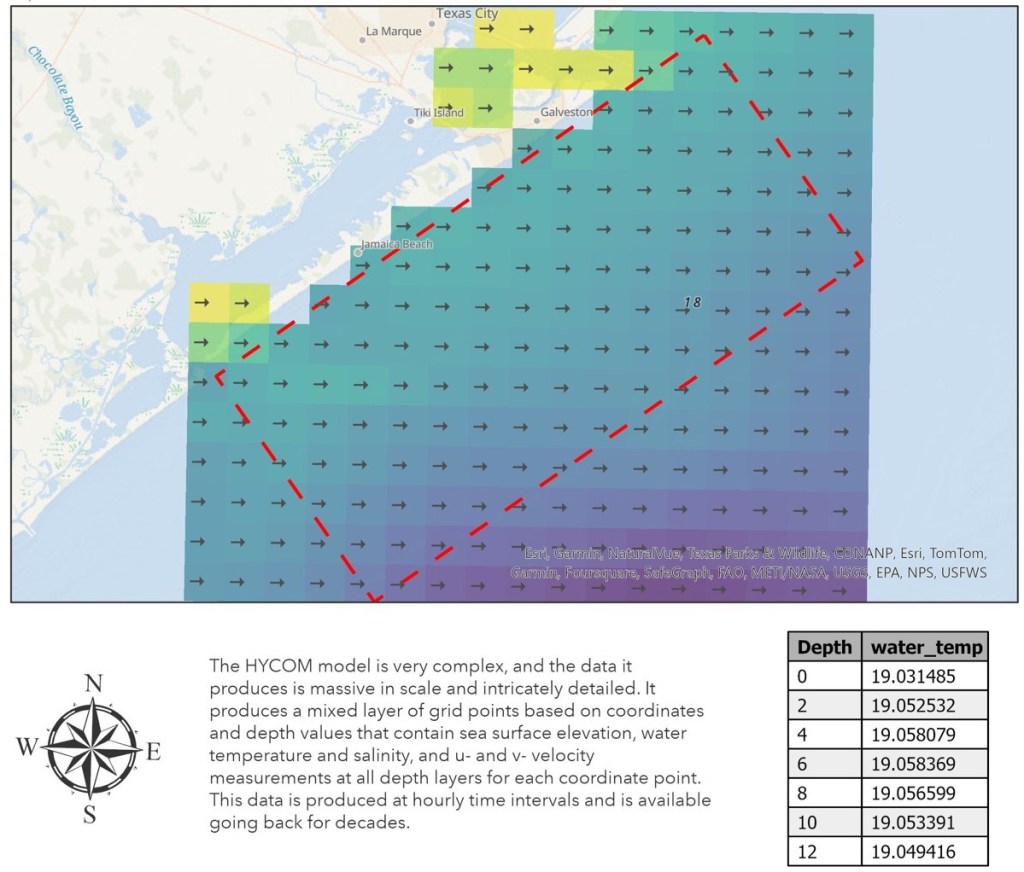
This tool creates formatted data based on individual user input, which can be used in ArcGIS and other applications. The output data sets are point feature classes and raster data sets. Shown below is an example of the downloaded data once it has been processed for the area of interest (outlined in red).
Reflection
For this project, I worked on a solution for a challenge I have at work. Downloading and preparing this data for use is extremely cumbersome and developing a tool to simplify that was very useful. In order to create this tool, I needed to understand the scope and complexity of the data involved.
Prior to this I hadn’t really created a script tool before, I learned a lot about the many steps and complications involved in creating a “simple” geoprocessing tool using Python scripting. Most of the development was done in Python but then transforming it to something that could be used in ArcPro was an entirely different experience.
The primary thing I learned from this experience is that while conceptually “writing a script” to perform a task may seem simple, that is quite removed from enabling a fully integrated, functional tool in a given platform.
Making Web Applications with MapsSDK for JavaScript
Problem Description
Sharing a map through a custom-designed web application using JavaScript is one of the projects I did in my course of study.
Analysis Procedures
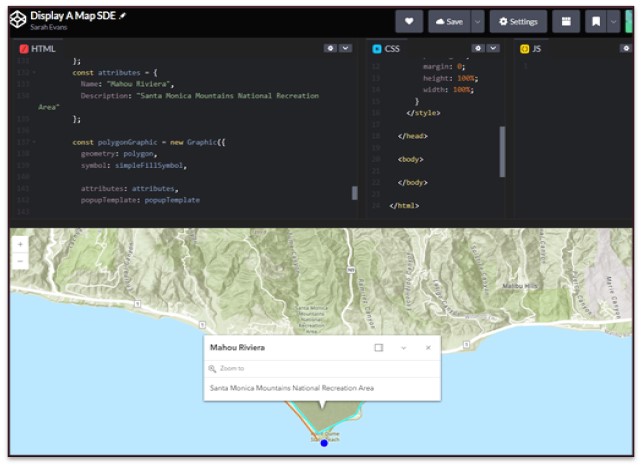
Use JavaScript to display a web map and add content to the map. I had no prior experience with SDK Developer for ArcGIS, so this was a very educational exercise for me. I used JavaScript to point to a web map I published on ArcGIS Online, then add features to it.
Results
The resulting map shows the base map, point and line features that were updated.
Reflection
This exercise opened up a completely different avenue for sharing web content. I learned and experimented with using JavaScript to manipulate web content. Learning that this is an option when designing and implementing web mapping applications was useful and applicable for real-world scenarios.
My skills and knowledge in this area were greatly improved through the projects I did in the MGIST coursework. I gained competency in Python scripting, geoprocessing automation, ArcPy, ArcGIS Pro tool development and HTML, SQL, JavaScript and Arcade.
