Study of the Changes in Sea Level in San Luis Pass, Galveston Island, Texas
Problem Description
Sea level rise is a known challenge related to climate change that affects coastal communities globally. In the Gulf of Mexico, however, sea level rise is occurring at a measurably higher rate according to a study published in Nature Communications in 2023.
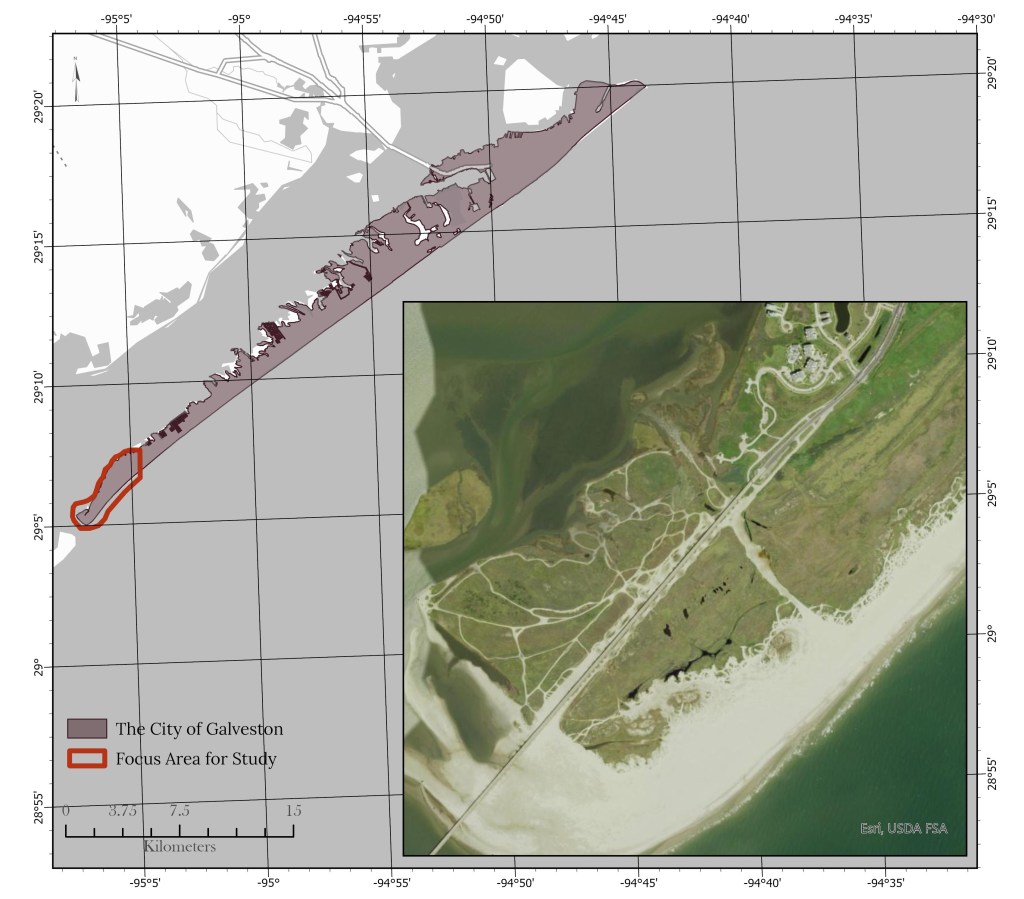
This study seeks to examine the risks of sea level rise on Galveston Island specifically, in the context of urban growth and development and population increase. The study area was selected to model shoreline changes and differences in elevation on a remote, unprotected portion of the island with the expectation that future work would apply the modeling processes to the entire island, including the urban areas.
Analysis Procedures
For this study the focus area was chosen because it is an unprotected, dynamic part of the shoreline where changes can be easily measured. Regular erosional patterns characteristic of barrier islands can be observed here, and this portion of the island is less densely populated than the east end.
I began by researching available data sources and identifying what would be useful to this study. During that process of discovery, I downloaded over 300 LAS and TIF files in various resolutions and quality levels. I processed the LIDAR data into digital elevation images and clipped those to an area of interest, then calculated the shoreline for each.
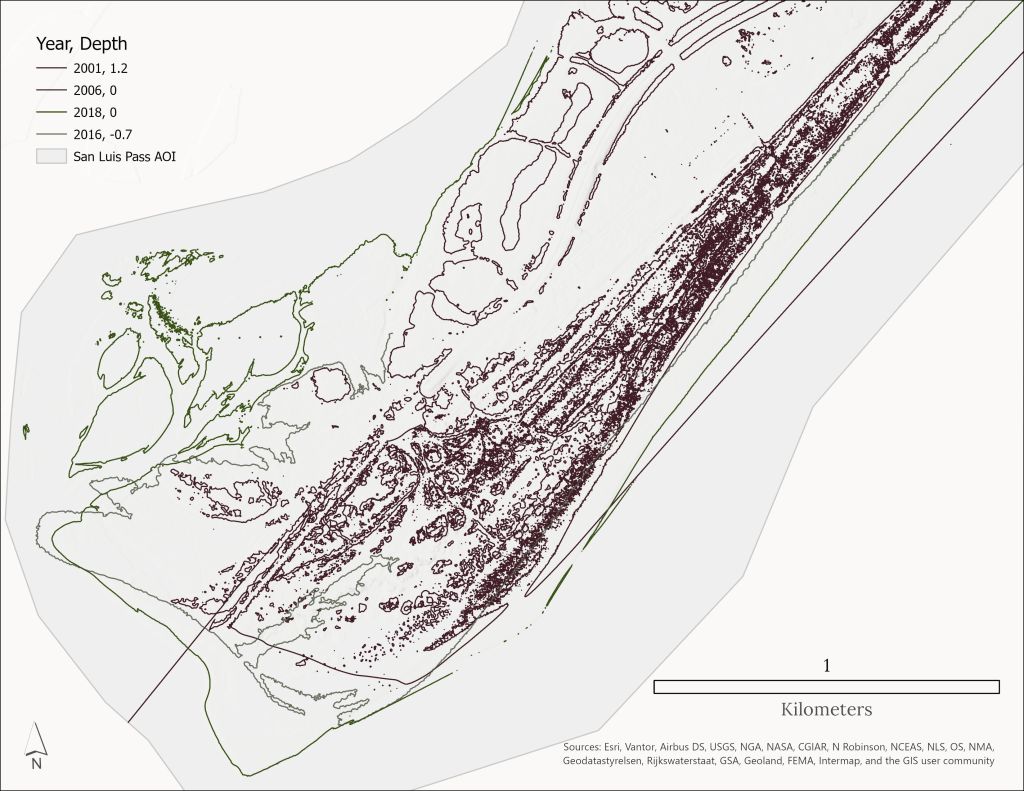
Using this data, I calculated a shoreline for each of my digital elevation models using the Contour geoprocessing tool and setting the z-value to .4 meters.
Once the elevation models and shoreline vectors were calculated, I used map algebra to compare the data sets and understand the changes. In ArcGIS Pro, I used the Raster Calculator geoprocessing tool to do this.
Results
As expected, my study found that the area of interest lost elevation during the time frame studied. In the images below, the model shows a loss of elevation in the far western end of the study area of 2.7 meters.
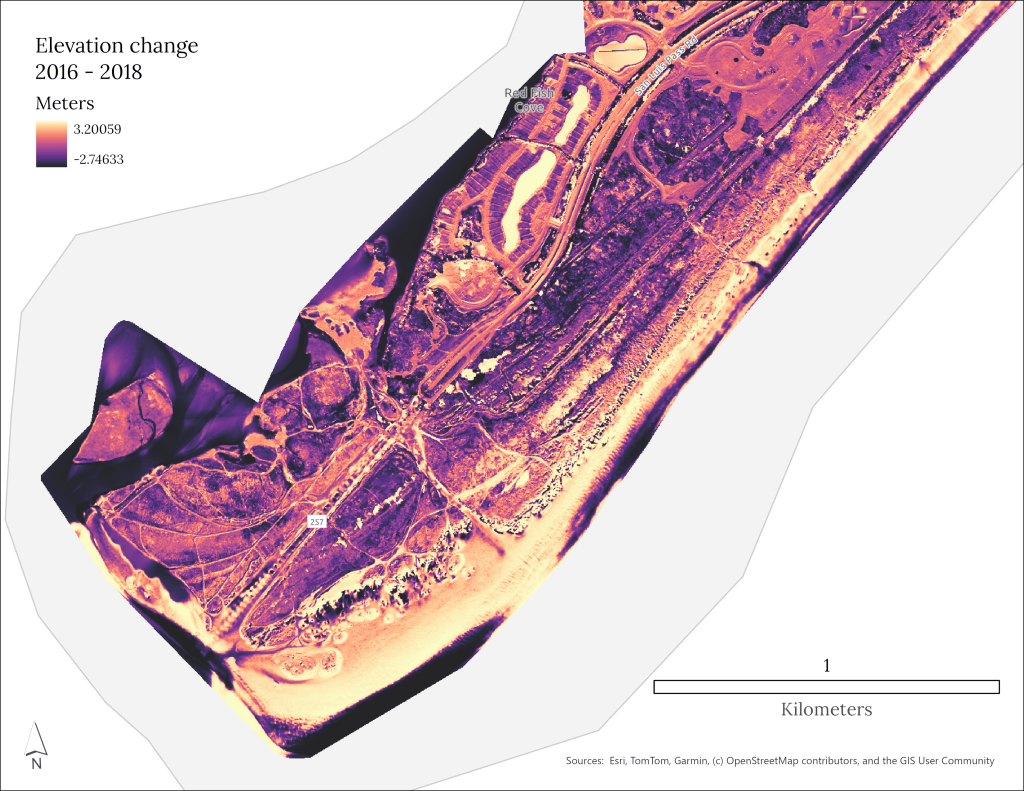
I used available lidar data to model the elevation changes of the study area over a period of several years. I extracted the shorelines from these digital models and compared them. This process illustrates the change over time, and future work will apply these workflows to the entire island.
The environmental impact risks to development and the overall population of the area may be greater than currently understood due to the factors described in this study. There is much ongoing research in this area, but there is a need for more focused modeling of potential long-term impacts to inform municipal, county and state plans for the region.
During the data acquisition stage, I learned that even though there are multiple agencies offering publicly available lidar data for download, most of those agencies are sourcing from the same data acquisition so there is not actually a range of available lidar data for the region.
When I was comparing the extracted shoreline contours to the digital elevation models for 2001, it looked so different from the modern imagery basemap that I questioned the data processing. However, when I located some old images of the area, imported and georeferenced them, they aligned very well with my model and data, showing that in fact the shoreline has changed dramatically since 2001.
Reflection
This research was particularly meaningful to me because I grew up in the Gulf Coast region and have observed the population increase over decades, the continued development of Galveston Island, and the devastation of several natural disasters. I wanted to study this area to better understand and illustrate the unique vulnerability of the region.
I learned a lot about the data that was (and wasn’t) available for public use, and about the extensive research information available through government sites.
Model the Impact of Air Pollution on the Health of Lindale Park in Houston, TX
Problem Description
A study of seasonal air quality and pollution levels in an urban neighborhood with a vulnerable demographic.The study site is situated between three major interstate highways, which produce a 24-hour nonstop stream of traffic that intensifies significantly during rush hours. Additionally, there is a very large, active rail yard nearby where trains coming up from the Port of Houston switch routes. There is also intense seasonal pollen explosions from the region’s prolific oak and pine trees. These factors significantly contribute to air quality challenges in general but may be more impactful for vulnerable populations.
Analysis Procedures
Investigate the particulate matter and pollen levels data over time, determine the changes between 6-9 a.m. on weekdays, and during the months of February-May and September-November to better understand the levels of anthropomorphic pollution in the area, the seasonal pollen concentrations, and if prevailing wind patterns intensify or mitigate these conditions then compare these results to available data about the health of the community.
I did this by first analyzing the available data and creating data sets for traffic peak times, particulate matter including pollen saturations in a sample period, and accessing the US Census data on vulnerable populations. Then I used geoprocessing methods to calculate continuous data over three days for four chemical levels in 24 hours.
After creating the research data, I clipped it to the study area, overlaying it with current demographic information, population, traffic and wind direction and speed data. Then I extrapolated the information from the nearby measuring sites to the study area, buffered key sites of concern, and analyzed the results.
Results
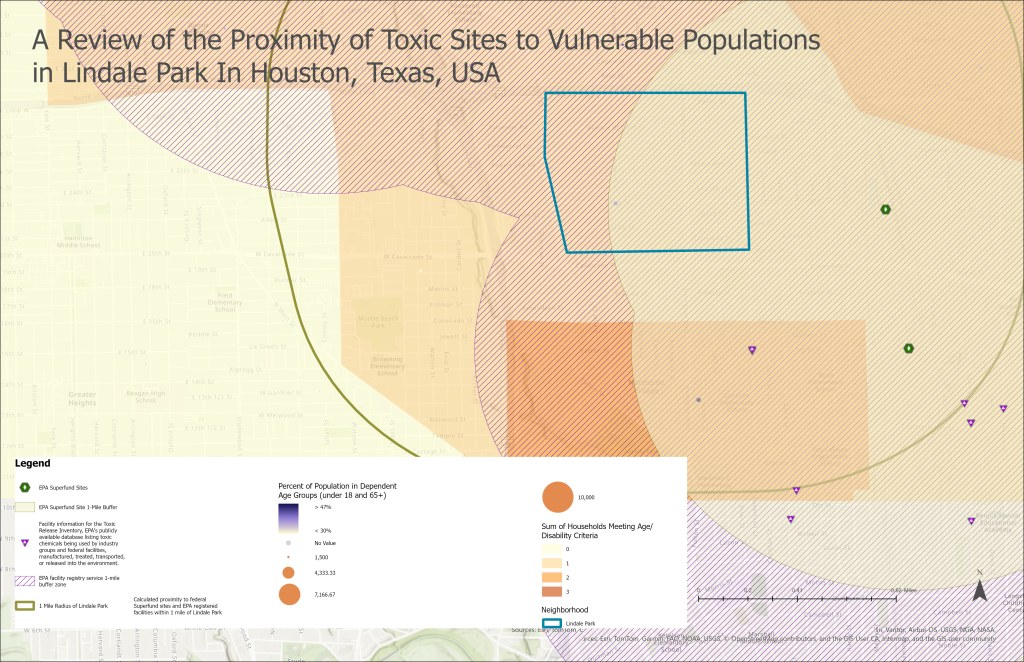
According to the American Community Survey data from the Census Bureau, the population of the community is 5,758, with 18% over the age of 65 and 23% under the age of 17. There are 765 people with a disability in this census tract.
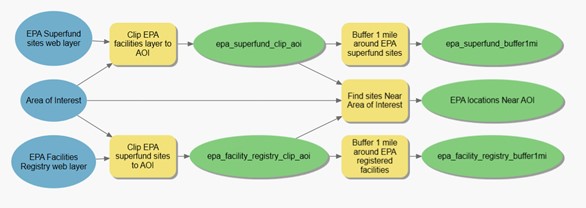
Overall air quality meets EPA guidelines for safety, but the measured particles become more dense from 2020 to 2022, showing an increase in measured criteria gases. There are 7 registered EPA points within a mile of this community, including two superfund sites. The Environmental Protection Agency (EPA) defines a superfund site as an existing contaminated site where hazardous waste was dumped, left out or improperly managed and are currently being cleaned up by the EPA.
The overlay demonstrates that people on the eastern side of Lindale Park are within the buffer zone of these sites. This proximity could potentially expose vulnerable groups to increased toxic chemicals, especially if they have underlying health conditions or are impacted by the current air quality levels. Further study is needed to understand the health status of the community and if there is any measurable effect from the air quality and proximity to toxic sites.
Reflection
In this project, I analyzed public data to determine environmental risks in a community. The findings surprised me, and I learned a lot about the data and how I can effectively use GIS to analyze and model the environment. Projects like this can be very informative for local residents and potential home buyers.
