Structuring a Database for Site Collection Results from a Web Application
Problem Description
The objective here was to provide user-accessible, interactive data to be consumed in a web mapping application. This data needed to be structured in a reasonable and useful way that made sense for the application.
Analysis Procedures
To do this I used Microsoft Access to review the relationship map of the data provided, then created a new relational database in pgAdmin based on that structure. I imported the CSV files to pgAdmin, defined tables, then created custom views using SQL queries. Once the data was organized, I created an SDE database using ArcPro and imported feature classes containing culture data, as well as the data tables and views I created.
That SDE data provided the basis for my geoprocessing model and the maps that would become web feature services. In ArcPro, I used Model Builder to create a model that selected vertebrate site sampling locations and culturally relevant structures within a user defined distance and published it to ArcServer as a custom geoprocessing tool.
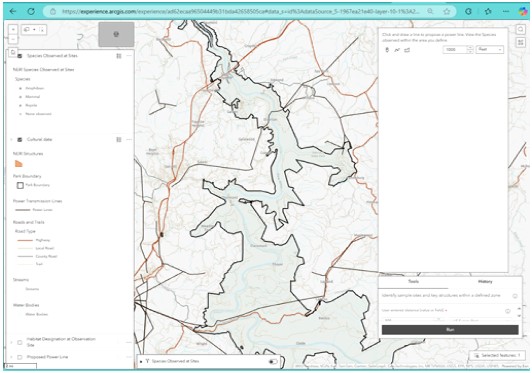
I published my map services and built out my web map in ArcGIS Online and used Experience Builder to create my interactive web application. I used Arcade expressions in the web map to configure the pop-ups so that they would be as informative as possible for the user. Some of the fields had to be reconfigured and there was some iteration on the final data sets, but the result was worth it.
Results
The resulting web application enables users to explore the impact potential high transmission lines may have in their community. It lets users explore the data in detail and print an output to take away. I learned a great deal about data management, and structuring data for consumption in web applications.
Reflection
This project was both challenging and exciting for me because I had the opportunity to enhance my data management skills and develop new application design capability using ArcGIS Experience Builder, which I had not used much before this. It was especially meaningful for me to go from unstructured data all the way through application development, infrastructure management to the end result of a user-interactive web application.
Diagraming Relationships to Design PostgreSQL Databases
Problem Description
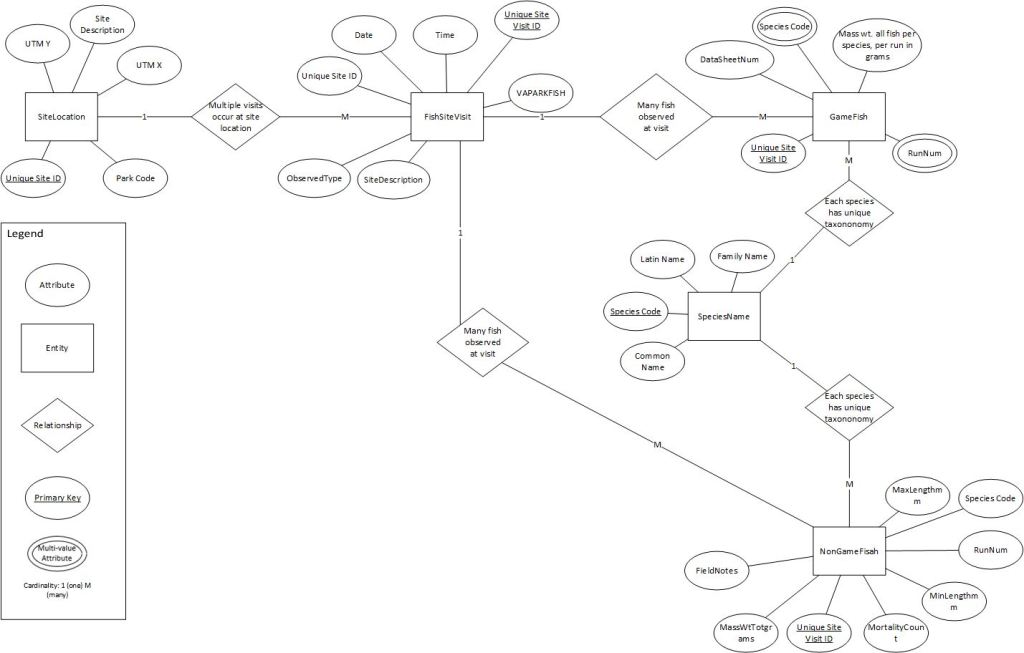
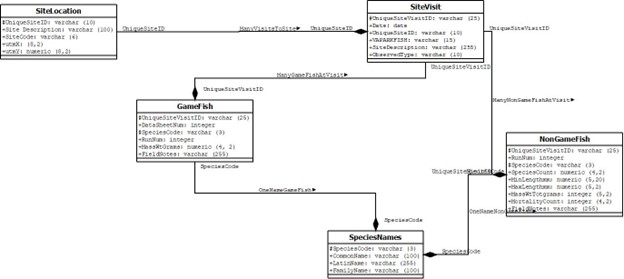
This was an assignment where I was asked to create a Unified Modeling Language (UML) diagram based on an E-R diagram, then create a Data Definition Language (DDL) statement and design a PostgreSQL database using the DDL statements and populate the database with unstructured data.
Analysis Procedures
First, I reviewed the data and determined what the relational keys would be. Then I mapped the relationships, shown in the image below, and used that model as the basis for the database design.
When the diagrams were finished, I used that structure as the basis for a PostgreSQL database. Then I used query statements to extract the data I wanted for each table
Results
The results were various tables showing the queried data, as well as diagrams that describe the data and structures.
Reflection
The processes and vocabulary, as well as the tools used for this work, were completely new to me. I found them to be very useful, and the practice of mapping out data connections graphically is something I will do in my future work
