Study of the changes in sea level in Luis Pass, Galveston Island, Texas
Problem Description
Measure impacts of sea level rise in Galveston Island. This study seeks to examine the risks of sea level rise on Galveston Island specifically, in the context of urban growth and development and population increase. The study area was selected to model shoreline changes and differences in elevation on a remote, unprotected portion of the island with the expectation that future work would apply the modeling processes to the entire island, including the urban areas.
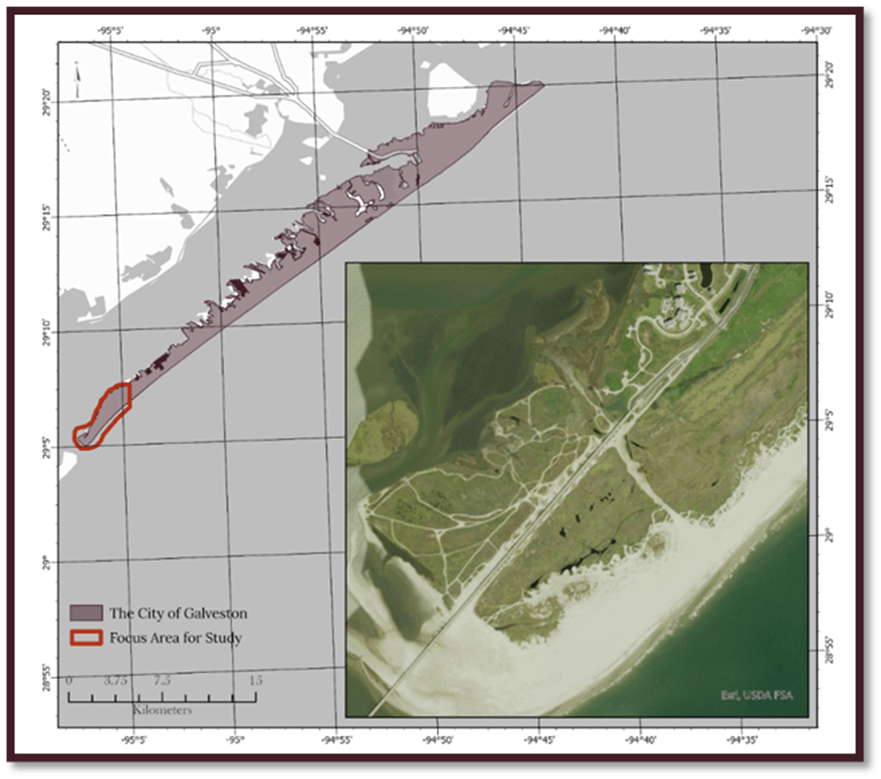
The map image shows the City of Galveston, with an inset of the area of study referred to as San Luis Pass.
Analysis Procedure
I began by researching available data sources and identifying what would be useful to this study. During that process of discovery, I downloaded over 300 LAS and TIF files in various resolutions and quality levels. I created an ArcGIS Pro project with a map for each data type- lidar, digital elevation models, imagery, culture data and analysis.
I created a data catalog in Excel where I captured the name of each file I downloaded, its file type and the link to where it originated so I could capture proper citation and metadata and I created a project log to document my workflows.
Once the data was identified, I then began processing it so it would be suitable for the study.
To calculate the shoreline, I looked up the mean high-water datum for my study area on the NOAA Tides & Currents site. The image below illustrates the key references needed to measure elevation and shoreline changes in the area.
Using this data, I calculated a shoreline for each of my digital elevation models using the Contour geoprocessing tool and setting the z-value to .4 meters.
Once the elevation models and shoreline vectors were calculated, I used map algebra to compare the data sets and understand the changes. In ArcGIS Pro, I used the Raster Calculator geoprocessing tool to do this.
Results
As expected, my study found that the area of interest lost elevation during the time frame studied. In the images below, the model shows a loss of elevation in the far western end of the study area of 2.7 meters.
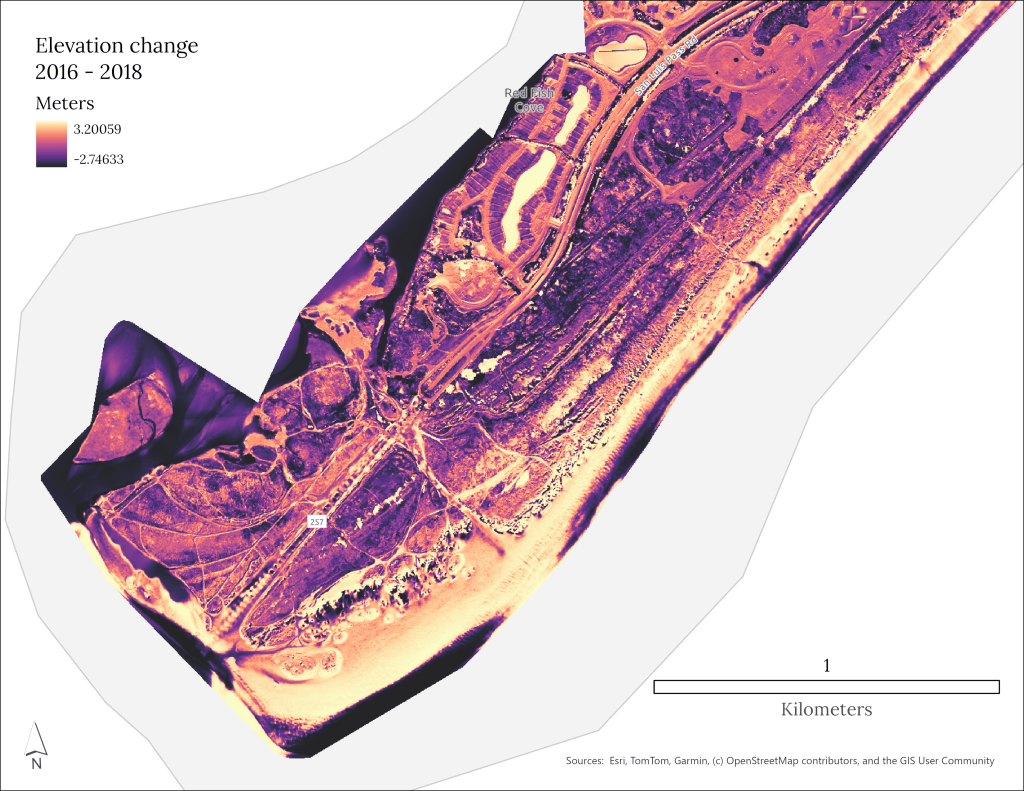
The map displays a digital elevation map highlighting the spatial distribution of these changes, with the greatest losses occurring at the far western end of the study area.
I used available lidar data to model the elevation changes of the study area over a period of several years. I extracted the shorelines from these digital models and compared them. This process illustrates the change over time, and future work will apply these workflows to the entire island.
I examined available data for land use on the island during the time period, the images below show the differences. The series of maps below illustrate the changes in land use over time from palustrine and estuarine wetlands to more developed areas. There is also an increase in tree cover in the urban/developed part of the island by 2021. These images show the impact of continued development as well as storms that have occurred during that time.
Reflection
There is a substantial amount of literature that examines the effects of climate change and sea level rise on the Gulf of Mexico.
The environmental impact risks to development and the overall population of the area may be greater than currently understood due to the factors described in this study. There is much ongoing research in this area, but there is a need for more focused modeling of potential long-term impacts to inform municipal, county and state plans for the region.
During the data acquisition stage, I learned that even though there are multiple agencies offering publicly available lidar data for download, most of those agencies are sourcing from the same data acquisition so there is not actually a range of available lidar data for the region.
When I was comparing the extracted shoreline contours to the digital elevation models for 2001, it looked so different from the modern imagery basemap that I questioned the data processing. However, when I located some old images of the area, imported and georeferenced them, they aligned very well with my model and data, showing that in fact the shoreline has changed dramatically since 2001.
